BASIC STEPS AND HELP
STEP 1 - Protein alignment
Protein alignment
First and the most important part of any data analysing job is gathering information. You have to have as many homologous protein sequences as possible and also corresponding DNA/RNA sequences (mRNA converted to DNA sequence) of these genes. Next step is to generate a protein multiple sequence alignment (MSA). One possible way is to use online tools, if you have less than 100 sequences and the time how long one job takes is not so essential. For example, it is possible to use these tools:1. http://tcoffee.crg.cat/apps/tcoffee/do:regular
2. http://tcoffee.vital-it.ch/apps/tcoffee/do:expresso
3. http://www.ebi.ac.uk/Tools/msa/clustalo/
4. http://www.ebi.ac.uk/Tools/msa/muscle/
NB! It is very important to check and assess the multiple sequence alignment.
One possibility is to use Core/TCS [http://tcoffee.crg.cat/apps/tcoffee/do:core] to score your alignment, but we recommend to use you own “eye” as well to evaluate the MSA. It is important to throw out sequences, which don’t suit well and induce large gaps to MSA. Also if you think some columns or rows are incorrectly aligned or some gaps are excessive, you should correct it, for example with MEGA software [http://www.megasoftware.net/]. After the corrections it is recommended to check MSA score again with Core/TCS and see if it is improved.
STEP 2 - cRegions front page
cRegions front page
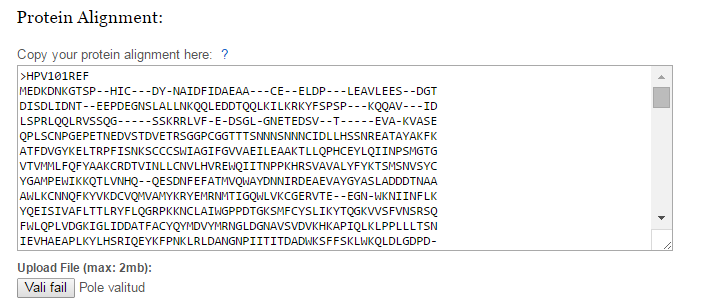 Figure 1. | Copy a protein multiple sequence alignment to this text box or upload a file. Protein multiple sequence alignment must be in FASTA format. |
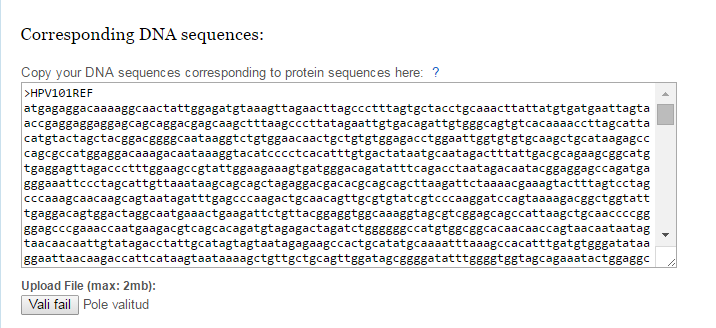 Figure 2. | Copy DNA sequences corresponding to protein sequences to this text box or upload a file. DNA sequences must not include introns and it has to be 5’-> 3’ direction, it must be coding sequence (CDS). These sequences must be with exact same name as in protein alignment or in exact queue. Sequences must be in FASTA format. |
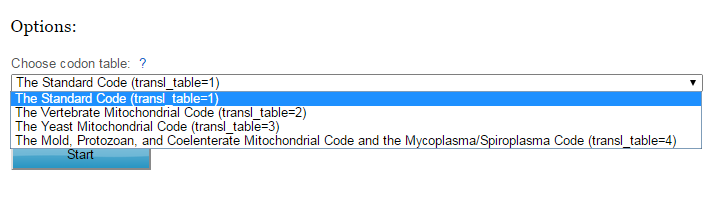 Figure 3. | This is an advanced option, preferred codon table can be selected (default is standard codon table). |
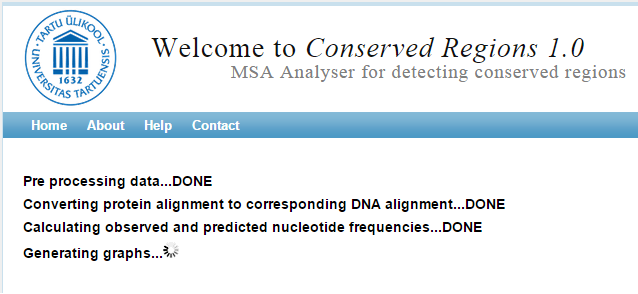 Figure 4. | After you have inserted or uploaded your data and selected correct codon table, you can press Submit to run cRegions. This screen appears. |
STEP 3 - Results screen options
Results screen
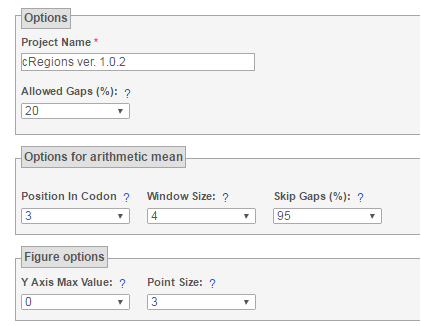 Figure 1. | Project Name - edit project name to change subtitles on graphs. Allowed Gaps - If the number of GAPs in one column in multiple sequence alignment exceeds this number (in percentage), then the statistic (RMSD,MAXDIF,CHISQ) is not calculated at that position (column) and this column is not included on graphs. Also arithmetic mean can not be calculated for that position and for positions that are inside selected window size. Position in Codon - This value is only used under tab Arithmetic mean. Choose a position in three-nucleotide codon over which you want to find the arithmetic mean. For example, if you have chosen 3rd position in three-nucleotide codon, then the arithmetic mean is calculated over sequential three-nucleotide codons in multiple sequence alignment, but only their 3rd position is taken in the calculation. Window Size - The number of columns that are used in arithmetic mean calculation. If you have chosen 3rd position in three-nucleotide codon and window size 6, then arithmetic mean is calculated over 6 consecutive three-nucleotide codons. Only the statistic value in the 3rd position of three-nucleotide codon is taken into account. Therefore, the first point on arithmetic mean graph is actually codon´s 3rd position (if it was possible to calculate) and arithmetic mean is calculated from positions 3,6,9,12,15,18 Skip Gaps - If the number of GAPs in one column in multiple sequence alignment exceeds this number (percentage), then that column is skipped in arithmetic mean calculation instead of terminating arithmetic mean calculation. For example if you try to find arithmetic mean over 6 consecutive (window size 6) three-nucleotide codons (codon´s 3rd position) 3,6,9,12,15,18 in MSA and position 18 has mostly GAPS (over 95%), arithmetic mean can not be calculated for all these positions (3,6,9,12,15,18). But if there is insertion only in one sequence (causing GAP in position 18, then it should be skipped and position 21 included to arithmetic mean calculation. Therefore, if position 18 has over 95% of gaps, then arithmetic mean is calculated over positions 3,6,9,12,15,21 Point Size - It is the size of a point on a graph Y-axis max value - If you want to compare graphs, you can make y-axis comparable. Only for RMSD and MAXDIF at the moment. |
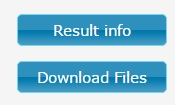 Figure 2. | Result Info - When clicked, message box appears with additional info. It will show the name of the protein alignment and the DNA sequences file, if the data is inserted to text field, it will show ‘From text field’. There is also static link, which can be used to reopen your job. Download Files button - From here you can download different raw data files connected to cRegion work. |
STEP 4 - Results screen graphs
Results graphs
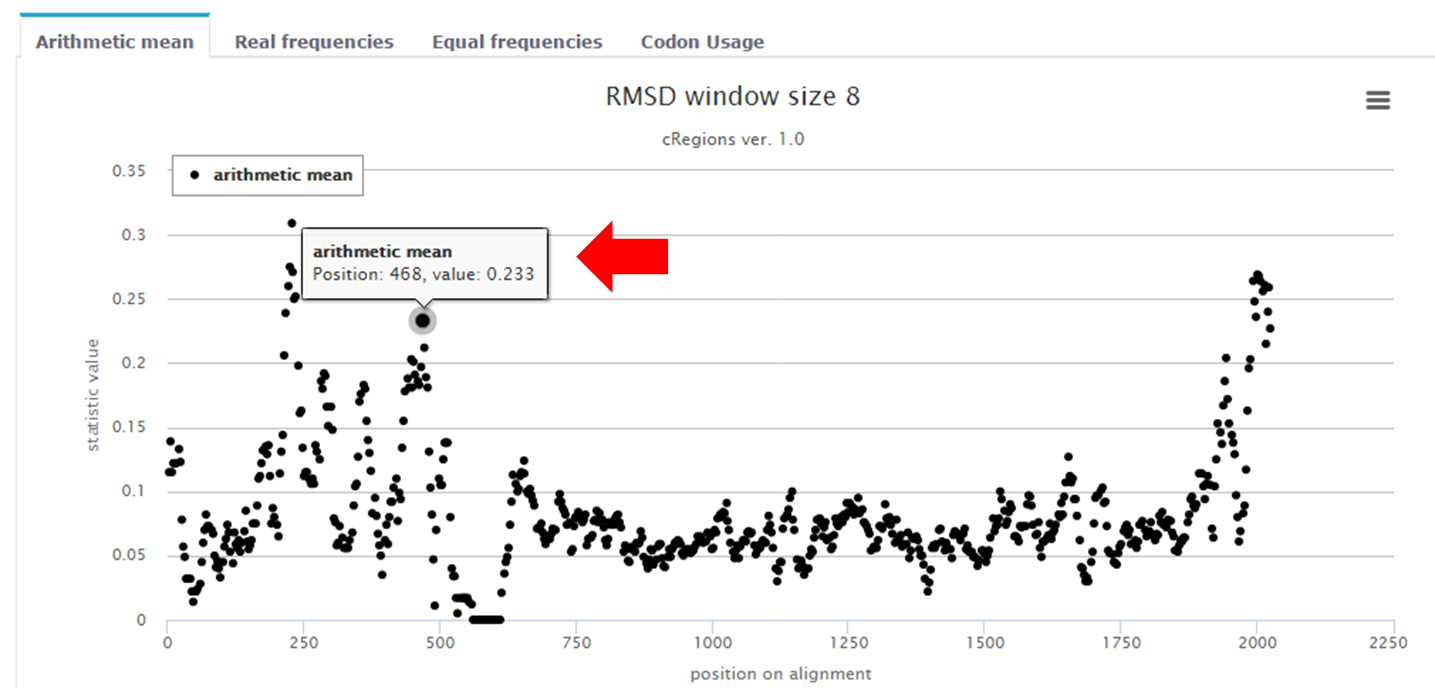 Figure 1. | Tooltip box - tooltip box contains information about the position in multiple sequence alignment. In this case the value of the arithmetic mean is shown first. For example, if we select window size=3 and codon position 3, then the arithmetic mean is calculated from values at codon positions 3, 6 and 9 in DNA/RNA multiple sequence alignment and the value of arithmetic mean is inserted to position 3. Next arithmetic mean is calculated from positions 6, 9 and 12 and the value is inserted into position 6 and etc. |
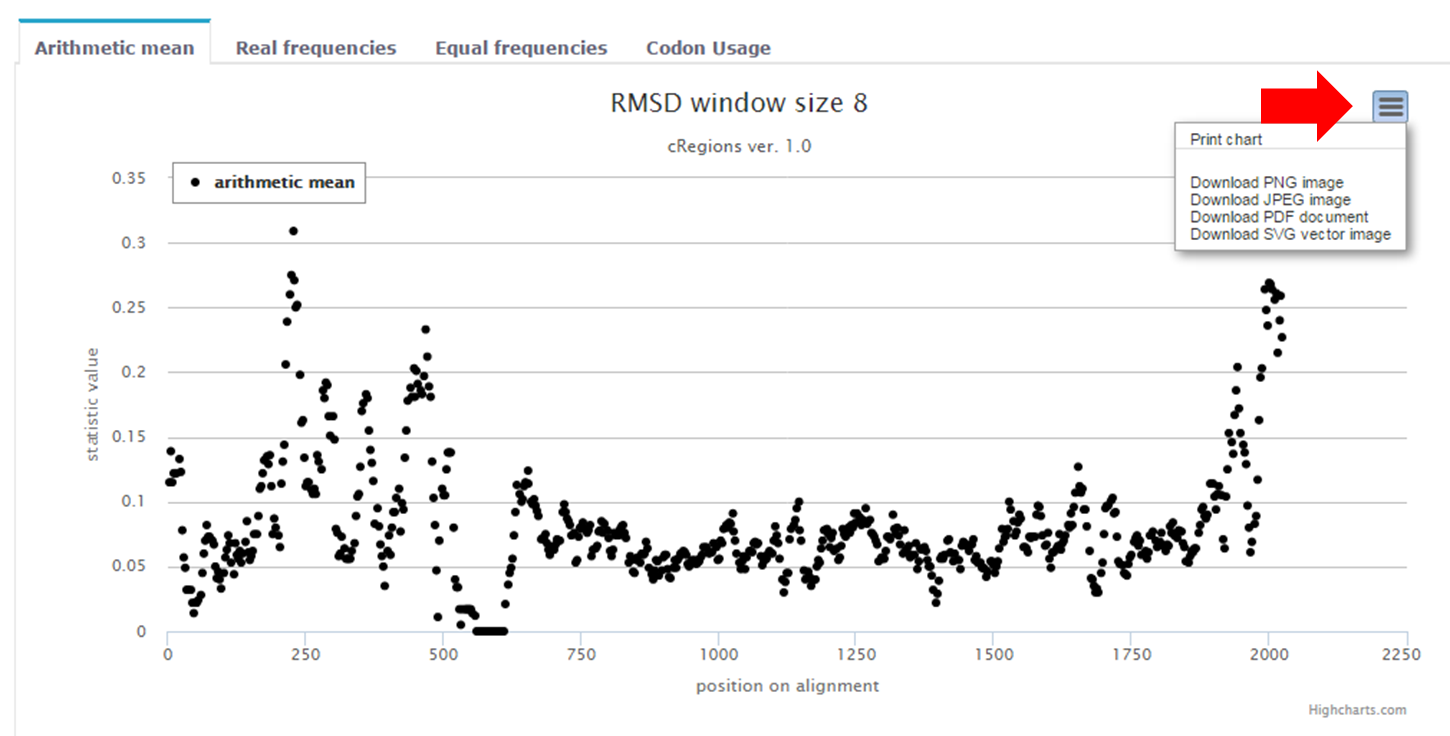 Figure 2. | Save a graph as image file - If you want to save the graphs as picture in different formats, click this button in the right corner. |
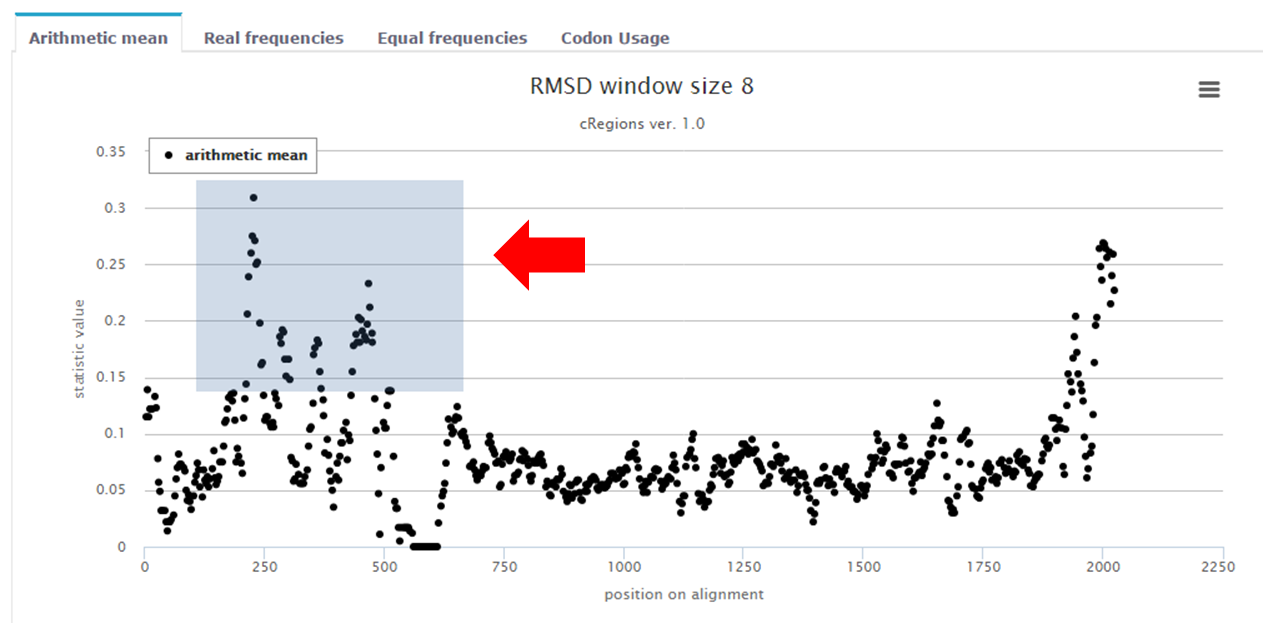 Figure 3. | Zoom - In order to zoom in into some region, you have to click and drag the computer mouse over that area. In this example, the grey area will be zoomed into |
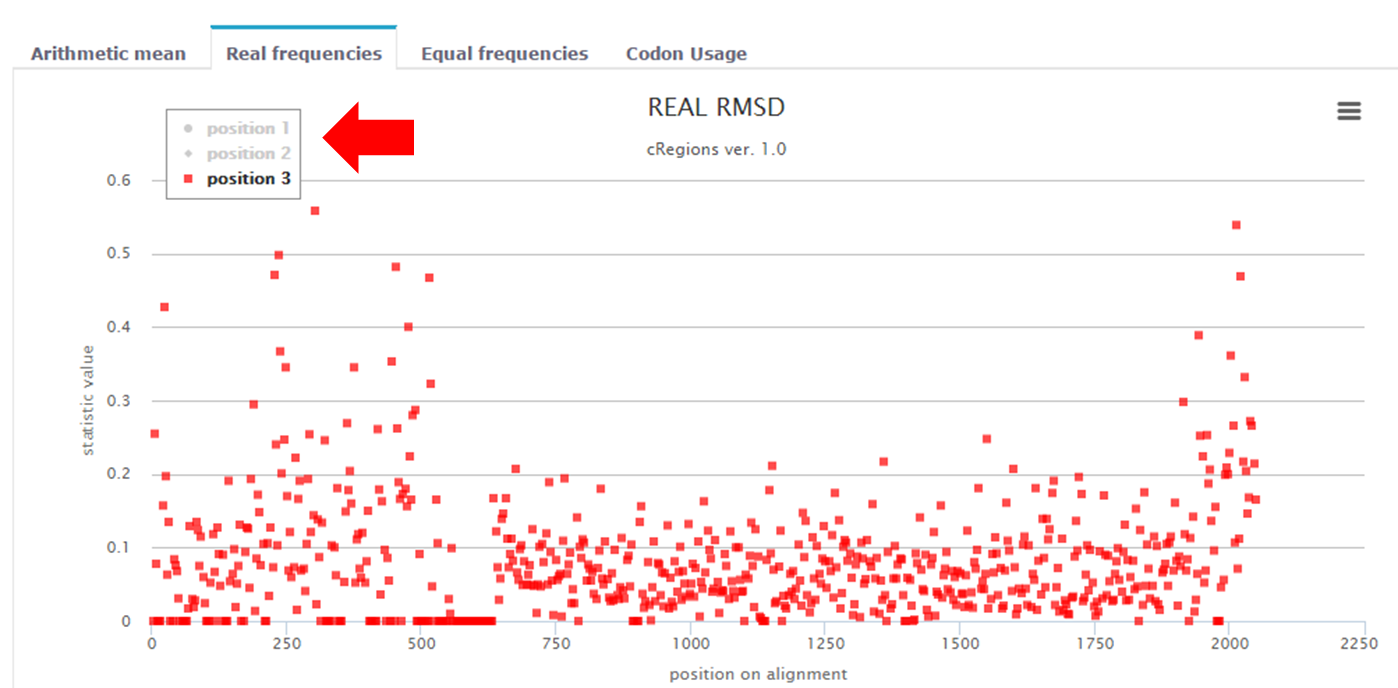 Figure 5. | Legend - By clicking on a position 1 or position 2 or position 3 on the legend, you can remove data points from the graph. |
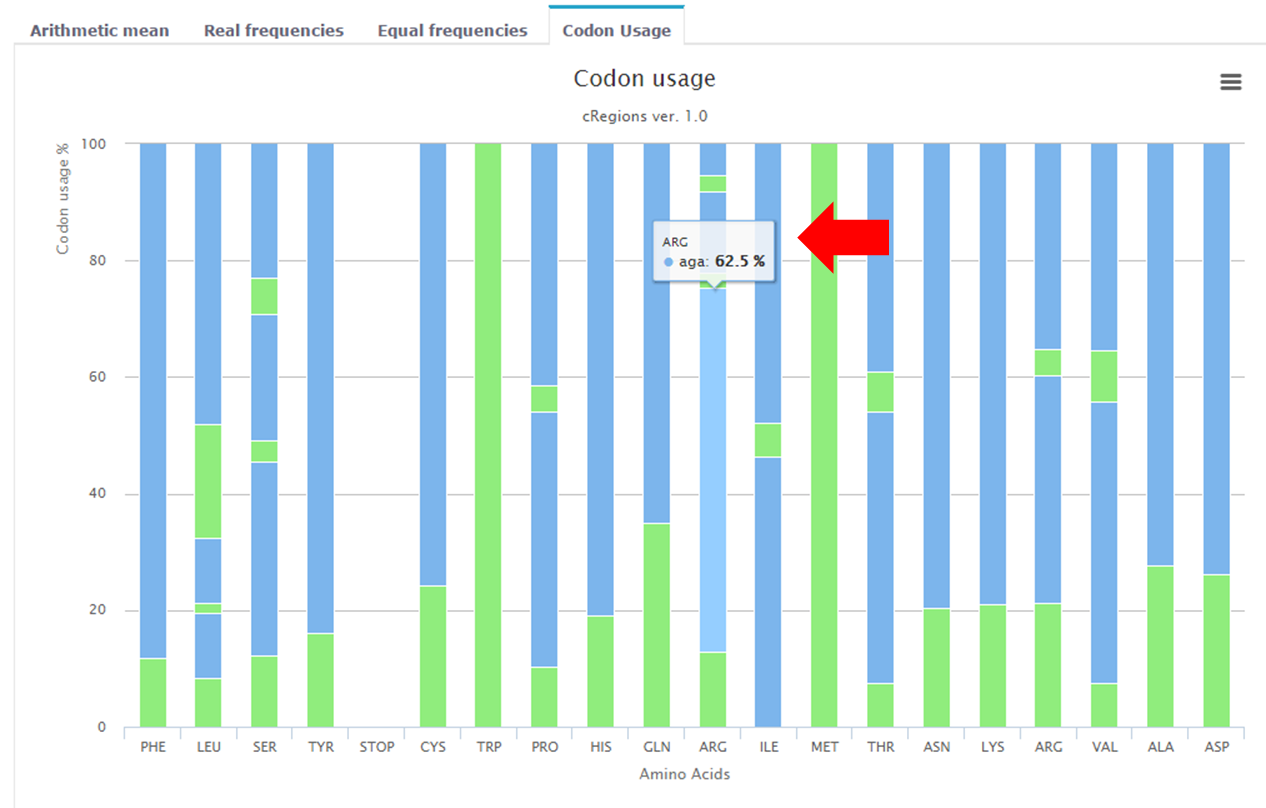 Figure 6. | Codon usage - On this interactive graph you can see the average codon usage across protein coding genes which were analysed. |
STEP 5 - How to interpret the results?
Papillomavirus E1 protein
In this example, we look at papillomavirus E1 protein (figure 1). It is known that there are a N-terminal regulatory region and four different functional domains. We want to know if there are any conserved regions in E1 protein coding sequence (CDS)? In this example we already know in advance that there are 4 conserved regions: one splice donor site at the 5’ end of the CDS (it is about 15 nucleotides from the beginning of the E1), a conserved region with unknown function[1], a dual coding area (E8 CDS is about 35 nucleotides long) and overlapping area at the end of E1 CDS (E1 and E2 gene overlap is about 50 nucleotides long). If these regions are important for this organism then the selective pressure is stronger at the nucleotide level relative to the amino acid level in the major reading. Therefore, certain codons will be preserved over long evolutionary time. With cRegions, it is possible to detect these regions.
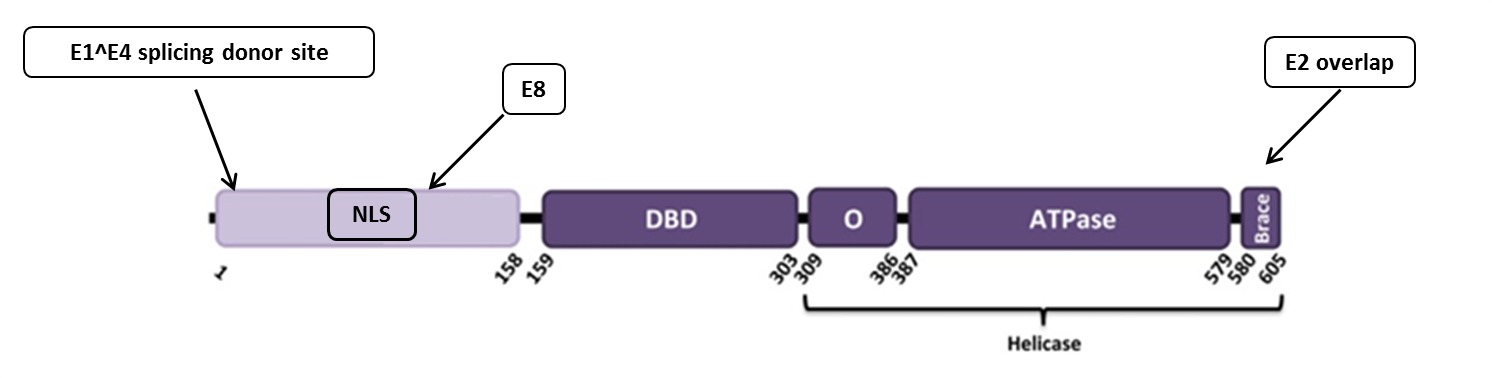 Figure 1. BPV1 E1 protein. The N-terminal regulatory region is shown in light purple, domains that are required for viral DNA-replication in vitro are colored in dark purple. The diagram shows the locations of the nuclear localization signal (NLS), DNA binding domain (DBD), minimal oligomerization domain (O), ATP-binding domain and C-terminal brace [2]. Additionally, black arrows show regions in E1 protein coding gene, which are conserved at DNA level. First is E1^E4 splicing donor site, second is E8 CDS (+1 reading frame and it ends with splicing donor site and it is about 35 nucleotides long) and the third one is E2 overlap (E1 protein coding gene overlaps with E2 protein coding gene about 50 nucleotides at the end). |
In this example 49 E1 genes are analysed from Gammapapillomaviruses. Results are shown on figure 2, which represents arithmetic mean of RMSD statistic values (3rd position of a codon and window size 8 is used). It can be seen clearly that there are peaks (conservations at DNA level) at locations, which were mentioned above.
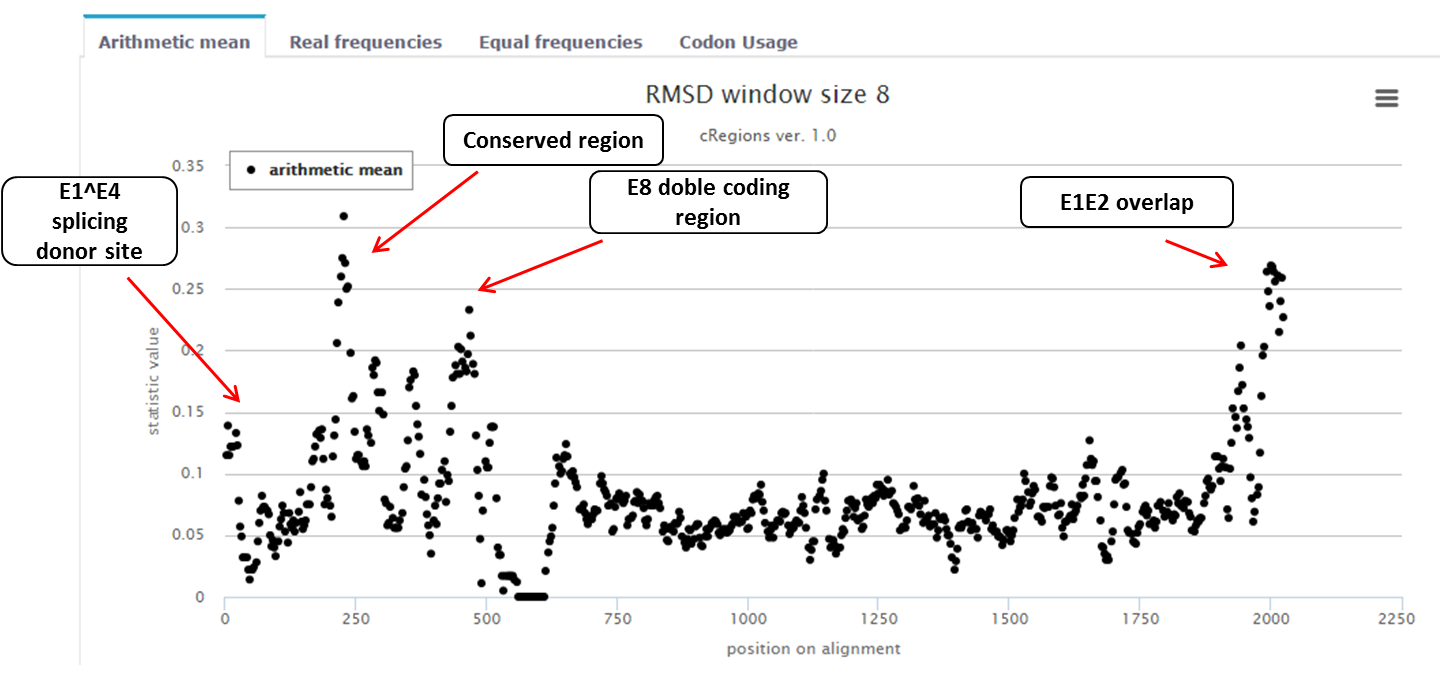 Figure 2. |
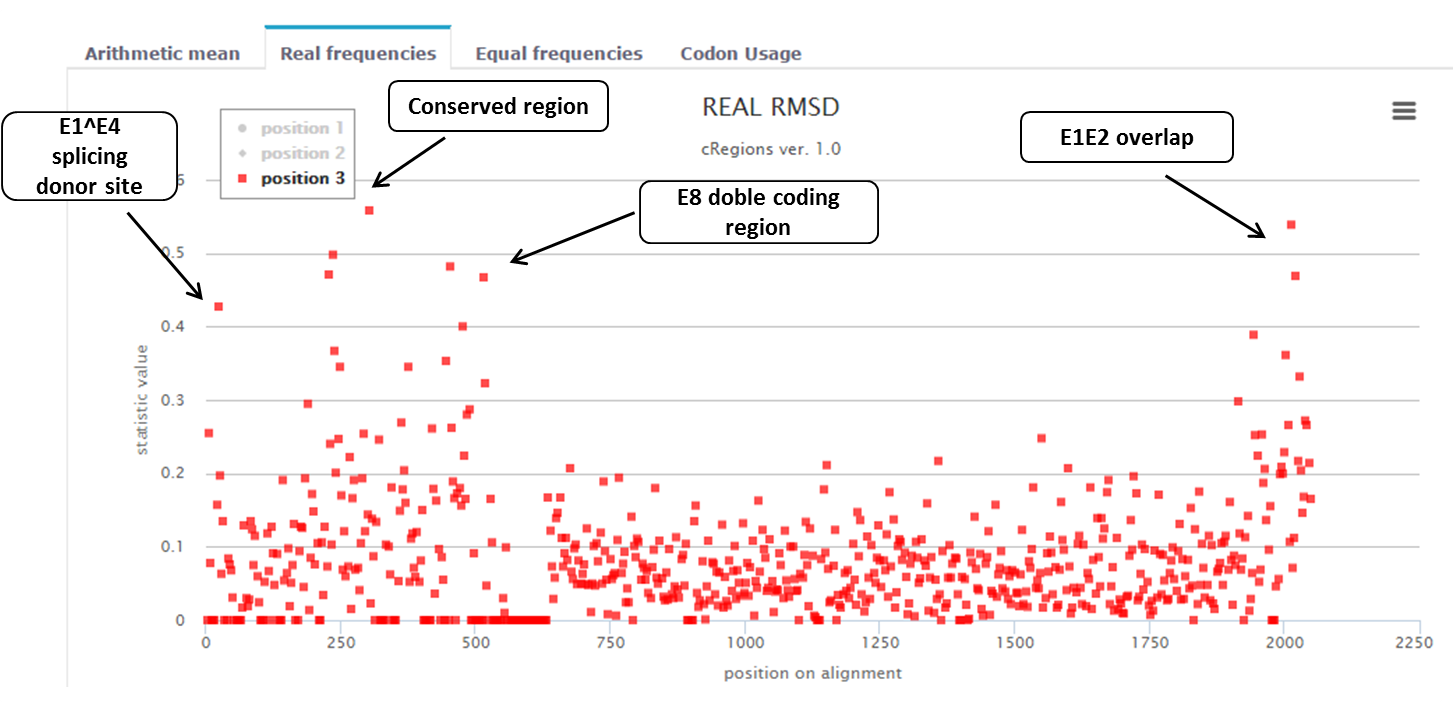 Figure 3. |
Which peaks are important? How to set a threshold?
We suggest to analyse peaks, which exceed 1.96 standard deviation.
If you do not know in advance, what to look for, then how should you interpret the results?
At the moment, the best solution is to look CDS multiple sequence alignment at these positions where signal peaks are located. CDS multiple sequence alignment can be downloaded from cRegions result page (button Download files), the file name is pal2nal_output.