Current citation
cRegions—a tool for detecting conserved cis-elements in multiple sequence alignment of diverged coding sequences.
Puustusmaa M, Abroi A.
doi:10.7717/peerj.6176
Introduction
How the genetic code is translated among all organisms is quite similar. A three-nucleotide sequence (a codon) almost always sets only one corresponding amino acid, except termination codon. Thus, one codon equals one amino acid, but not another way around. Still, some varieties exist in codon translation, comparing some organisms or mitochondrial and nuclear mRNA translation (https://www.ncbi.nlm.nih.gov/Taxonomy/Utils/wprintgc.cgi). Using variations of four different nucleotides (A, C, G, T) with repetition, you can create 64 different codons, but there are not as many amino acids. Thus, there can be more than one (synonymous) codon for each amino acid. This is called codon degeneracy or redundancy of the genetic code.
Mostly, the amino acid sequence of a protein is conserved in order to maintain its function and structure. However, the conservation may also be caused by the selection at the nucleic acid level due to essential cis-acting sequences located in the protein-coding region. Thus, certain regions in a protein-coding sequence might encode specific amino acids, not because of the selective pressure to the amino acid sequence, but because of the conservation at the nucleic acid level in DNA or RNA. There can be multiple reasons: the existence of nucleic acid secondary structures, splice sites, binding sites for proteins (e.g. transcription factors) or short RNAs, internal promoters, ribosome frameshifting signals, subgenomic promoters in RNA viruses, viral packaging signals, and other regulatory elements. Additionally, the conservation at nucleic acid level might be caused due to overlapping reading frames, which are common in viruses, but also occur in cellular organisms (Okazaki et al., 2002; Shendure & Church, 2002; Veeramachaneni et al., 2004; Belshaw, Pybus & Rambaut, 2007; Rancurel et al., 2009; Chirico, Vianelli & Belshaw, 2010; Firth, 2014).
cRegions was developed to identify regions within a protein-coding sequence where the conservation in the amino acid sequence is caused by the conservation in the nucleotide sequence. The cRegion can be used as the first step tool in discovering novel cis-acting sequences from diverged protein-coding genes. The results can be used as a target in a further experimental analysis.
Implementation
Giving homologous protein-coding genes sufficient time to accumulate substitutions, we should see different synonymous codons coding the same amino acid (or different codons coding amino acid with similar properties). The overall principle of the cRegions tool is to compare observed and predicted nucleotide frequencies with expected proportions and calculate appropriate metrics (described below) to detect regions where the coding sequence is more conserved than expected. Scripts used in the cRegions web tool are available in Github repository at https://github.com/bioinfo-ut/cRegions. The workflow of cRegions is as follows:
1. Two inputs are required: a protein multiple sequence alignment (MSA) and nucleic acid sequences containing coding sequences (CDS) of respective proteins. Both inputs have to be in FASTA format. mRNA or the full genome can be used instead of the exact CDS. However, the coding sequence must not contain introns.
2. Protein alignment file is converted into a corresponding codon alignment using respective coding sequences with PAL2NAL (Suyama, Torrents & Bork, 2006)
3. Henikoff position-based sequence weights are calculated based on the codon alignment (Henikoff & Henikoff, 1994). These are used later to correct predicted frequencies.
4. Algorithm finds observed frequencies of nucleotides in each position in the codon alignment.
5. Algorithm calculates codon usage bias from the codon alignment. Input and calculated codon usage tables can be compared under the “codon usage table” tab.
6. Predicted nucleotide proportions are calculated for each position in the codon alignment based on the amino acid sequence and the codon usage bias (Fig. 2). Also, predictions are made based on uniform codon usage (Fig. 1). However, codon preference for serine codons in the TCN block and in the AG[A/G] are calculated separately.
7. The observed nucleotide frequencies are compared with predictions. Three different metrics are calculated only for positions with amino acids having more than one codon.
a. The algorithm uses R (R Development Core Team, 2014) to acquire p-values of Chi-Square Goodness of Fit Test (chisq.test) for each column in the codon alignment (formula A in Fig. 3). The test allows us to see whether the observed distribution of nucleotides is significantly different from expected distribution. Bonferroni correction is used to show the threshold with significance level p = 0.05. We used Bonferroni correction as it is most strict to avoid false positive hits.
b. Second metric is the root-mean-square deviation (RMSD) (formula B in Fig. 3). However, if a predicted probability of a nucleotide (or two) is zero then only three (two) nucleotides are included to RMSD calculation.
c. Third metric is the maximum difference (MAXDIF), which selects only a single nucleotide for each column that has the highest absolute difference between predicted and observed values (formula C in Fig. 3).
In all cases, the larger numerical value of a metric indicates higher conservation at the nucleic acid level. Additionally, if a position in the codon alignment has more than 20% of gaps, the metric is not calculated for that position.
Henikoff S., Henikoff JG. 1994. Position-based sequence weights. Journal of Molecular Biology 243:574–578. DOI: 10.1016/0022-2836(94)90032-9.
Suyama M., Torrents D., Bork P. 2006. PAL2NAL: Robust conversion of protein sequence alignments into the corresponding codon alignments. Nucleic Acids Research 34:609–612. DOI: 10.1093/nar/gkl315.
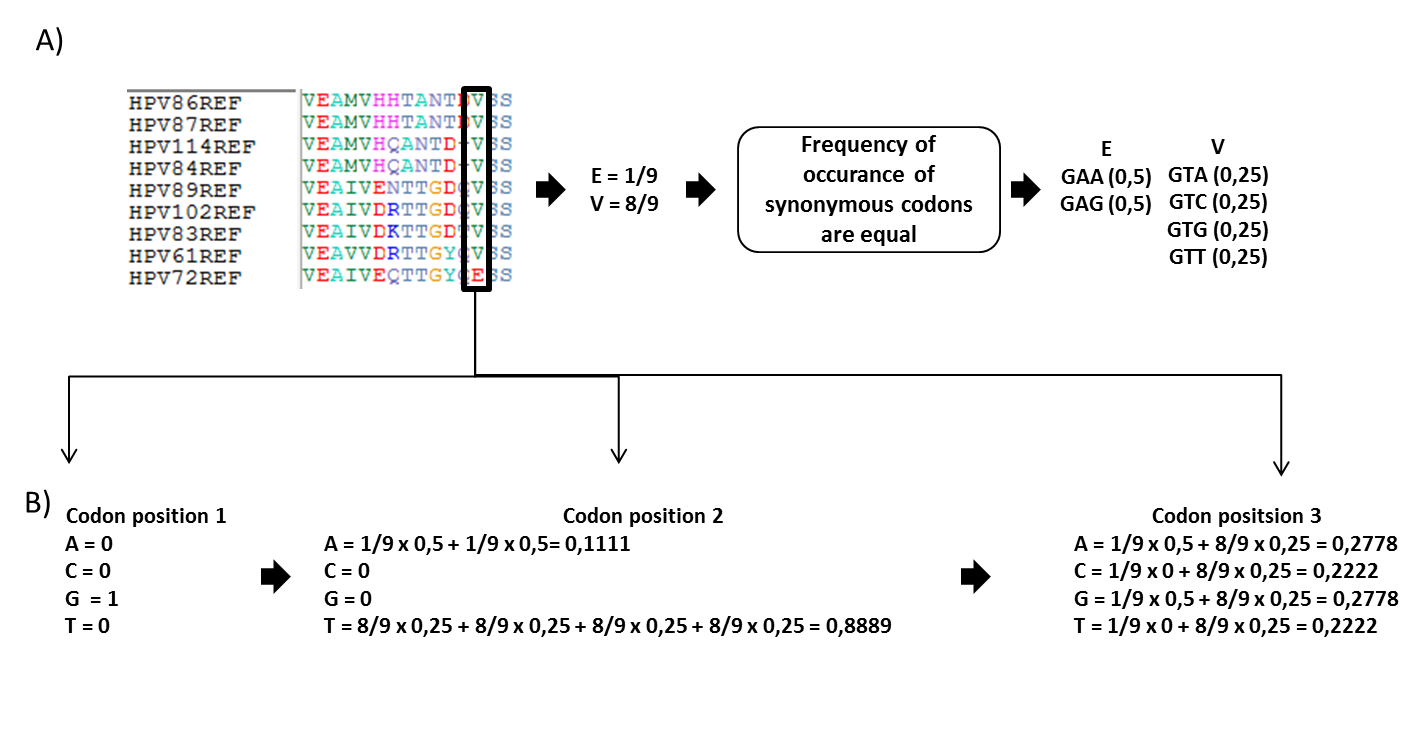 Figure 1. Uniform codon usage Predicted nucleotide proportions can be calculated based on unifrm codon usage, meaning that proportions of synonymous codons are equal (a) Multiple sequence alignment of E1 protein of 9 alphapapillomaviruses. If we analyse one column from MSA (marked with black box),it can be seen that two amino acids are present - 8 valines and 1 glutamic acid. It is known that valine is coded with 4 codons and glutamic acid with 2 codons (standard codon table). If codon usage bias is not taken into account, then frequencies of synonymous codons are equal, meaning that if we have 2 codons for valine, then frequency for both codons are 0,5 and if we have 4 codons for glutamic acid then for each codon frequency is 0,25. (b) Calculate predicted nucleotide frequencies for each codon position in MSA. For position 1 we can only have guanine, but in position 2 we should observe adenine 11% of times, because both codons of glutamic acid have 'A' nucleotide in second position, but glutamic acid is observed only 1 time out of 9 in MSA. Also, we predict that T nucleotide should be observed about 89% of times in second position for the same reasons. In 3rd position of the codon we predict all 4 nucleotide with different frequencies. |
Why include codon usage bias of the same set of genes that are analysed?
During evolution, homologous protein-coding sequences accumulate random substitutions - switching to different synonymous codons (or to different codons coding amino acid with similar properties). Therefore, given sufficient evolutionary time, conservation of an amino acid sequence of a protein will not necessarily match the diversity of the nucleotide sequence. This can be observed with rapidly evolving protein-coding genes in viruses or bacteria. Thus, it can be reasoned that if mutations are random, then the multiple sequence alignment (MSA) of diverged homologous protein-coding sequences should show random variability in each position. However, many published works have showed that synonymous codons are not used with equal proportions (Moriyama & Powell, 1997; Duret, 2000, 2002; Castillo-Davis & Hartl, 2002; Zhao, Liu & Frazer, 2003; Plotkin et al., 2006; Bahir et al., 2009; Camiolo, Farina & Porceddu, 2012; Villanueva, Martí-Solano & Fillat, 2016). One hypothesis that explains the preferential use of synonymous codons is the adaptation towards translational efficiency - an abundance of aa-tRNA is correlated with synonymous codon usage (Duret, 2002; Plotkin et al., 2006). Castillo-Davis and Hartl have shown a correlation between the codon bias and levels of gene expression in Caenorhabditis elegans (Castillo-Davis & Hartl, 2002). In addition to C. elegans, in Drosophila melanogaster optimal codons correspond to the most abundant tRNAs (Moriyama & Powell, 1997; Duret, 2000). S. Camiolo et. al. have also observed systematic differences in codon usage among Arabidopsis thaliana genes that are expressed specifically in distinct tissues, because abundances of tRNAs differ (Camiolo, Farina & Porceddu, 2012). In case of viruses, in addition to translation efficiency, host adaptation theory is used to explain this preferential use of synonymous codons. Bahir et al. have showed that the codon usage is strongly related to the specific host in both bacterial and human viruses (Bahir et al., 2009). However, in contrast to their work, a study conducted on papillomaviruses has shown that the codon usage bias is attributed to the AT content rather than to host specificity (Zhao, Liu & Frazer, 2003). Thus, it can be reasoned that each protein-coding gene may have different preferential use of synonymous codons. This idea has been strengthened by Bahir et al. who showed that in viruses, the highest level of adaptation to host codon usage is for proteins which appear abundantly in the virion, meaning that the codon usage of virion and non-virion proteins differs (Bahir et al., 2009). Also, Villanueva et al. has proved that there is a difference in the codon usage between the adenoviral host-interacting fiber protein and the rest of structural late phase proteins (Villanueva, Martí-Solano & Fillat, 2016).
Additionally, multiple works have been performed on RNA viruses, which have revealed situations where synonymous mutation can have a significant impact on fitness of a virus. The genomes of many RNA viruses fold into complex secondary and tertiary structures that are important for replication, translation, or evasion of host innate immunity (Simmonds & Smith, 1999; Simmonds, Tuplin & Evans, 2004; Steil & Barton, 2009). Also, codon usage adaptation of lytic viruses to their hosts is determinant for viral fitness. Balanced codon usage in viral proteins is vital to adequately exploit cellular resources for efficient infection (Villanueva, Martí-Solano & Fillat, 2016). Jenkins et al. have showed correlations between codon usage bias and some characteristics of viral genome structure and ecology of human RNA viruses, suggesting that translational selection may also have some influence in shaping codon usage bias (Jenkins & Holmes, 2003). Thus, it can be reasoned that incorporating preferential use of synonymous codons of the same set of genes into the analysis is more reasonable than codon usage of entire organism.
Bahir I., Fromer M., Prat Y., Linial M. 2009. Viral adaptation to host: A proteome-based analysis of codon usage and amino acid preferences. Molecular Systems Biology 5. DOI: 10.1038/msb.2009.71.
Camiolo S., Farina L., Porceddu A. 2012. The relation of codon bias to tissue-specific gene expression in Arabidopsis thaliana. Genetics 192:641–649. DOI: 10.1534/genetics.112.143677.
Castillo-Davis CI., Hartl DL. 2002. Genome evolution and developmental constraint in Caenorhabditis elegans. Molecular biology and evolution 19:728–735. DOI: 10.1093/oxfordjournals.molbev.a004131.
Duret L. 2000. tRNA gene number and codon usage in the C. elegans genome are co-adapted for optimal translation of highly expressed genes. Trends in Genetics 16:287–289. DOI: 10.1016/S0168-9525(00)02041-2.
Duret L. 2002. Evolution of synonymous codon usage in metazoans. Current Opinion in Genetics and Development 12:640–649. DOI: 10.1016/S0959-437X(02)00353-2.
Moriyama EN., Powell JR. 1997. Codon usage bias and tRNA abundance in Drosophila. Journal of Molecular Evolution 45:514–523. DOI: 10.1007/PL00006256.
Plotkin JB., Dushoff J., Desai MM., Fraser HB. 2006. Codon usage and selection on proteins. Journal of Molecular Evolution 63:635–653. DOI: 10.1007/s00239-005-0233-x.
Zhao KN., Liu WJ., Frazer IH. 2003. Codon usage bias and A+T content variation in human papillomavirus genomes. Virus Research 98:95–104. DOI: 10.1016/j.virusres.2003.08.019.
Villanueva E., Martí-Solano M., Fillat C. 2016. Codon optimization of the adenoviral fiber negatively impacts structural protein expression and viral fitness. Scientific Reports 6. DOI: 10.1038/srep27546.
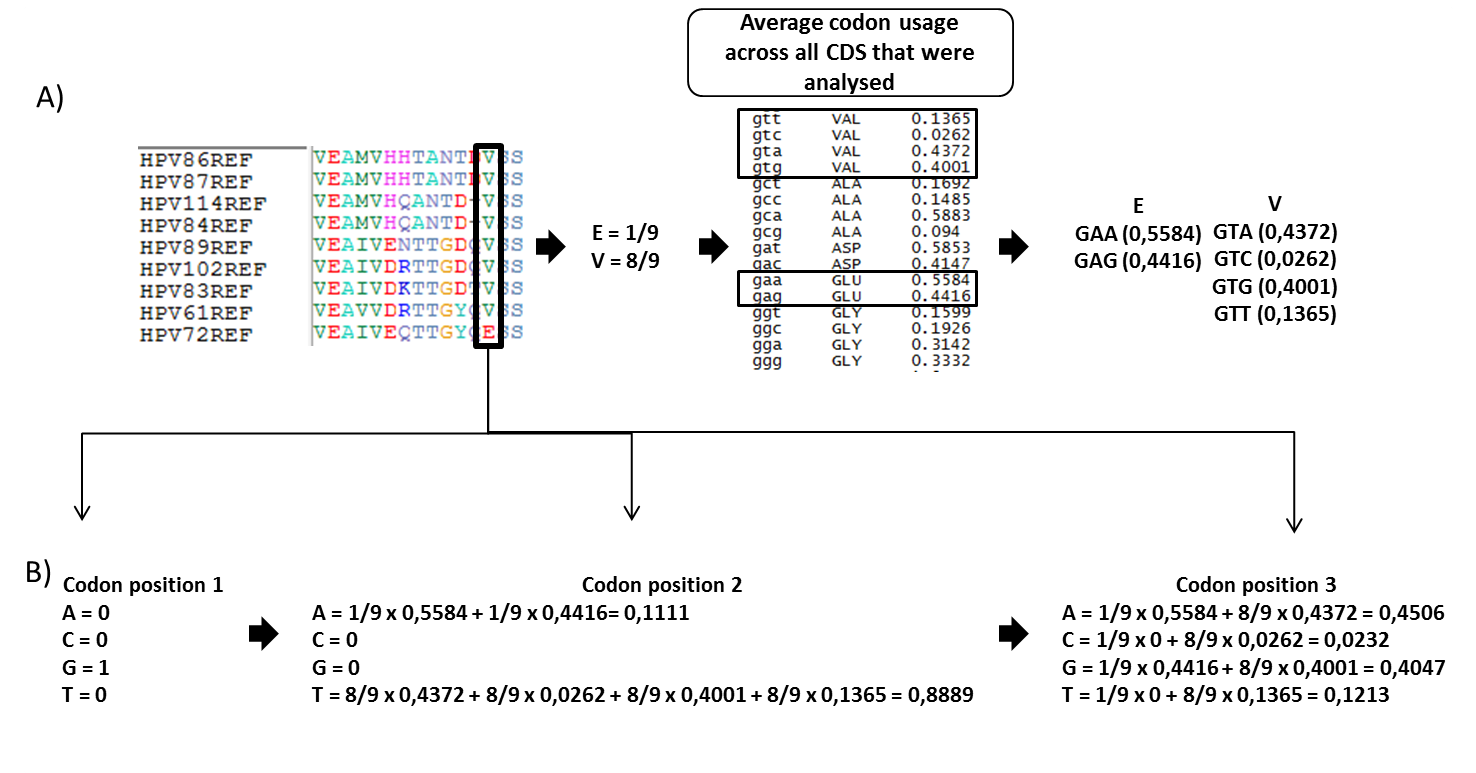 Figure 2. Predicted nucleotide proportions taking codon usage bias into account. (a) Multiple sequence alignment of E1 protein of 9 alphapapillomaviruses. Analysing one column from MSA (marked with black box), two amino acids can be observed - 8 valines and 1 glutamic acids. It is known that valine is coded with 4 codons and glutamic acid with 2 codons (standard codon table). From the table in the centre it can be seen that synonymous codons don't have equal frequencies in these genes. (b) Predicted nucleotide frequencies for each codon position in MSA. We can observe quite big differences in frequencies of predicted nucleotides compared to figure 1, where codon usage bias was not taken into account. |
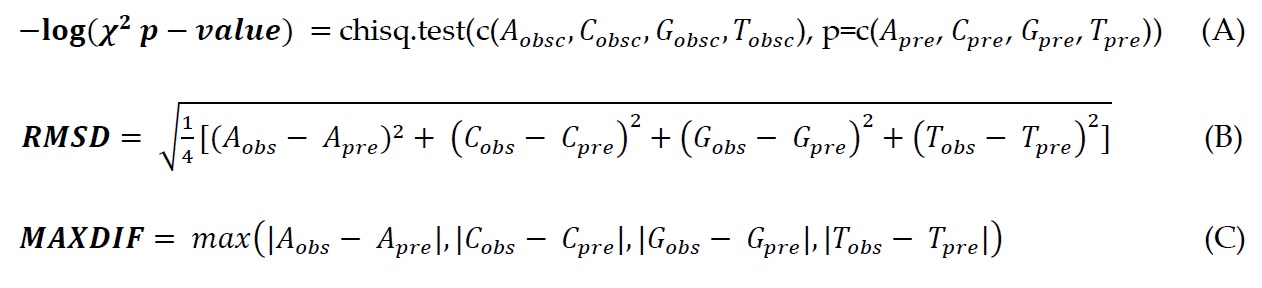 Figure 3. Three different methods are used to compare predicted and observed nucleotide frequencies (or proportions). Subscript “obs” means observed frequencies and subscript “pre” means predicted frequencies. First is the Chi-Square Goodness of fit test, where the metric value is –log(p-value). Second is the root-mean-square deviation. Third is MaxDif meaning maximum differences, in this case cRegions will choose only one nucleotide for every position, whose difference between predicted and observed frequencies is the highest and then shows that difference on graph. |